Jeff Larrimore
Journal Articles
Abstract
We find that each of the past four generations of Americans was better off than the previous one, using a post-tax, post-transfer income measure constructed annually from 1963-2022 based on the Current Population Survey Annual Social and Economic Supplement. At age 36–40, Millennials had a real median household income that was 18 percent higher than that of the previous generation at the same age. This rate of intergenerational progress was slower than that experienced by the Silent Generation (34 percent) and Baby Boomers (27 percent), but similar to that experienced by Generation X (16 percent). Slower progress for Generation X and Millennials is due to their stalled growth in work hours—holding work hours constant, they experienced a greater intergenerational increase in real market income than Baby Boomers.
Key Figures
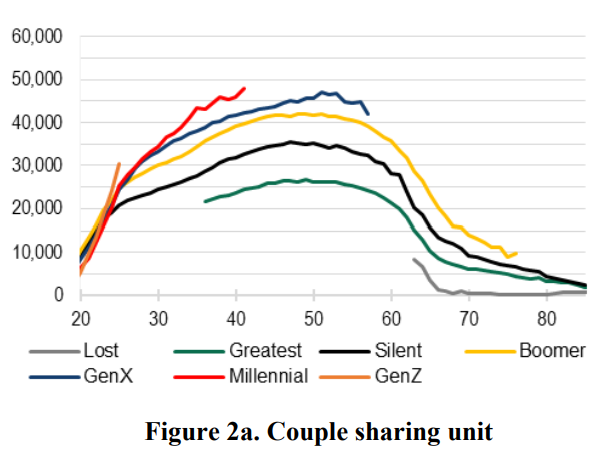
Income by age for each generation
Press
Abstract
A central aspect of poverty measurement is how well the measure can identify the people and places that are experiencing financial hardships. This paper explores the relationship between poverty and financial hardship by using the CFPB's financial well-being scale, which reflects individuals' self-assessments of their financial challenges. Using this measure, for every 1 percentage point increase in a state's official poverty rate for working-age adults, there is a 0.59 percentage point increase in the share of working-age adults with very low financial well-being. In contrast, the state's supplemental poverty rate is negatively correlated with the rate of financial hardship using the CFPB measure. This finding is due to the supplemental poverty measure's geographic adjustment shifting poverty towards areas that have lower rates of self-reported financial hardship.
Abstract
Using survey data from the Federal Reserve on buy now, pay later (BNPL) experiences merged with individual credit records, we examine BNPL use by race/ethnicity and gender and explore how it relates to people's financial circumstances. Overall, most BNPL users said they used BNPL for convenience or to spread out payments; yet, 57% used BNPL out of necessity. Liquidity- and credit-constrained consumers were among the most likely to use BNPL, and most did so out of necessity. For example, 84% of BNPL users with a credit score under 620 said they used BNPL because it was the only way they could afford their purchase. These findings highlight that while many BNPL users on firm financial footing find it to be a convenient way to make their purchase and spread out their payments, other consumers, and particularly those more financially vulnerable, may be at risk of overextending themselves.
Abstract
Banking the unbanked is a common policy goal, but should this include access to bank accounts for minors? This study estimates how teenagers' access to bank accounts affects their financial development. Using variation in state laws, we show policies that permit access to independently-owned accounts increase account ownership at age 16 through age 19, although by age 24 those young adults are banked at similar rates to teens who grew up in states that do not allow minors to own accounts independently. Teens who had access to independently-owned accounts use fewer high-cost alternative financial services (like payday loans) through age 20—but are then more likely to use AFS, particularly check-cashing services, from age 21 through 24. Using credit records, we show that access to non-custodial accounts has no effects on credit scores in the short-run, but lower credit scores and more loan delinquencies at ages 21 through 24.
Abstract
This paper considers the credit response of individuals after the implementation of new work requirements for Supplemental Nutrition Assistance (SNAP) benefits using a large nationally representative sample of credit records. It does so by exploiting county-level variation in the implementation of work requirements after the Great Recession in a difference-in-differences design. We find that the implementation of new SNAP work requirements leads more people to seek out new credit and leads to an increase in credit account openings. New work requirements also result in an increase in total outstanding balances on bank and retail card accounts and increase the number of borrowers that are past due on these accounts. These findings suggest that some individuals are turning to credit and debt products to cover expenses after losing eligibility for SNAP benefits.
Abstract
We evaluate progress in the War on Poverty as President Lyndon B. Johnson defined it, which established a 20% baseline poverty rate and adopted an absolute standard. While the official poverty rate fell from 19.5% in 1963 to 10.5% in 2019, our absolute full-income poverty measure—which uses a fuller income measure and updates thresholds only for inflation—fell from 19.5% to 1.6%. However, we also show that relative poverty reductions have been modest. Additionally, government dependence increased over this time, with the share of working-age adults receiving under half their income from market sources more than doubling.
Abstract
Using a panel of tax data, we follow the earnings of individuals over business cycles. Compared to prior recessions, the Covid policy response and recovery were far more progressive. Among workers starting in the bottom quintile, median real earnings including fiscal relief increased 66 percent in 2020 and earnings increases offset relief decreases in the 2021 recovery. After the prior two recessions, this measure had decreased by 24 percent. Among those starting in the top quintile, median and average real earnings were approximately unchanged. This difference from prior recessions is largely attributable to larger Covid-era stimulus payments and unemployment insurance.
Abstract
Unemployment Insurance (UI) benefits were a central part of the social safety net during the COVID-19 recession. UI benefits, however, are severely understated in surveys. Using administrative tax data, we find that over half of UI benefits were missed in major survey data, with a greater understatement among low-income workers. As a result, 2020 official poverty rates were overstated by about 2 percentage points, and corrected poverty reached a six-decade low. We provide data to correct underreporting in surveys and show that, compared to UI benefits, the UI exclusion tax creates complex incentive problems.
Abstract
The COVID-19 recession caused regressive market income changes in the United States, with large losses more frequent than during the Great Recession and more concentrated at the bottom of the distribution. Progressive taxes and transfers, especially from expanded unemployment insurance benefits and stimulus checks, dramatically offset these declines. Using administrative tax data, we show that public policies made large annual tax-unit level income declines in 2020 less common than during the Great Recession, as well as 2019, an expansionary year. These policies stabilized incomes over the entire distribution, but this effect was strongest among those starting with low incomes.
Abstract
We build panels from administrative tax data to measure annual earnings changes. The frequency of earnings declines during the pandemic were similar to the Great Recession, but the distribution was very different. In 2020, workers starting in the bottom half of the distribution were more likely to experience large annual earnings declines and a similar share of male and female workers had large earnings declines. While most workers experiencing large annual earnings declines do not receive unemployment insurance, over half of beneficiaries were made whole in 2020, as unemployment insurance replaced a median of 105 percent of their annual earnings declines.
Press
Abstract
Use of Internal Revenue Service (IRS) tax records improves researchers' ability to track income trends, although the focus on taxable market income in this research excludes important income sources. Using IRS data in combination with other data sources, we explore the effect of measuring inequality levels and trends with income, including real accrued capital gains based on Haig-Simons principles. While median market income fell 10% from 1989 to 2016, median economic income increased by 26% using our Haig-Simons-based measure. Top 1% income shares were lower and increased by only about one-third of that estimated using previous approaches over this period.
Abstract
A limitation of tax return data is the inability to identify members of separate tax units living in the same household. We overcome this obstacle and present the first set of entirely tax-based household income and inequality measures. We find using tax units as a proxy for households overstates household income inequality, as measured by Gini coefficients, by 13 percent. Consistent with previous findings, we also estimate that the CPS understates household income inequality by 5 percent.
Abstract
Using newly available administrative data from the IRS, this paper studies the distribution of employer-sponsored health insurance premiums. Previous estimates, in contrast, were almost exclusively from household surveys. After correcting for coverage limitations of IRS data, we find average premiums for employer-sponsored plans are roughly $1,000 higher in IRS records than in the Current Population Survey. The downward bias in the CPS results from underestimating premiums of married workers and topcoding of high premiums.
Key Figures
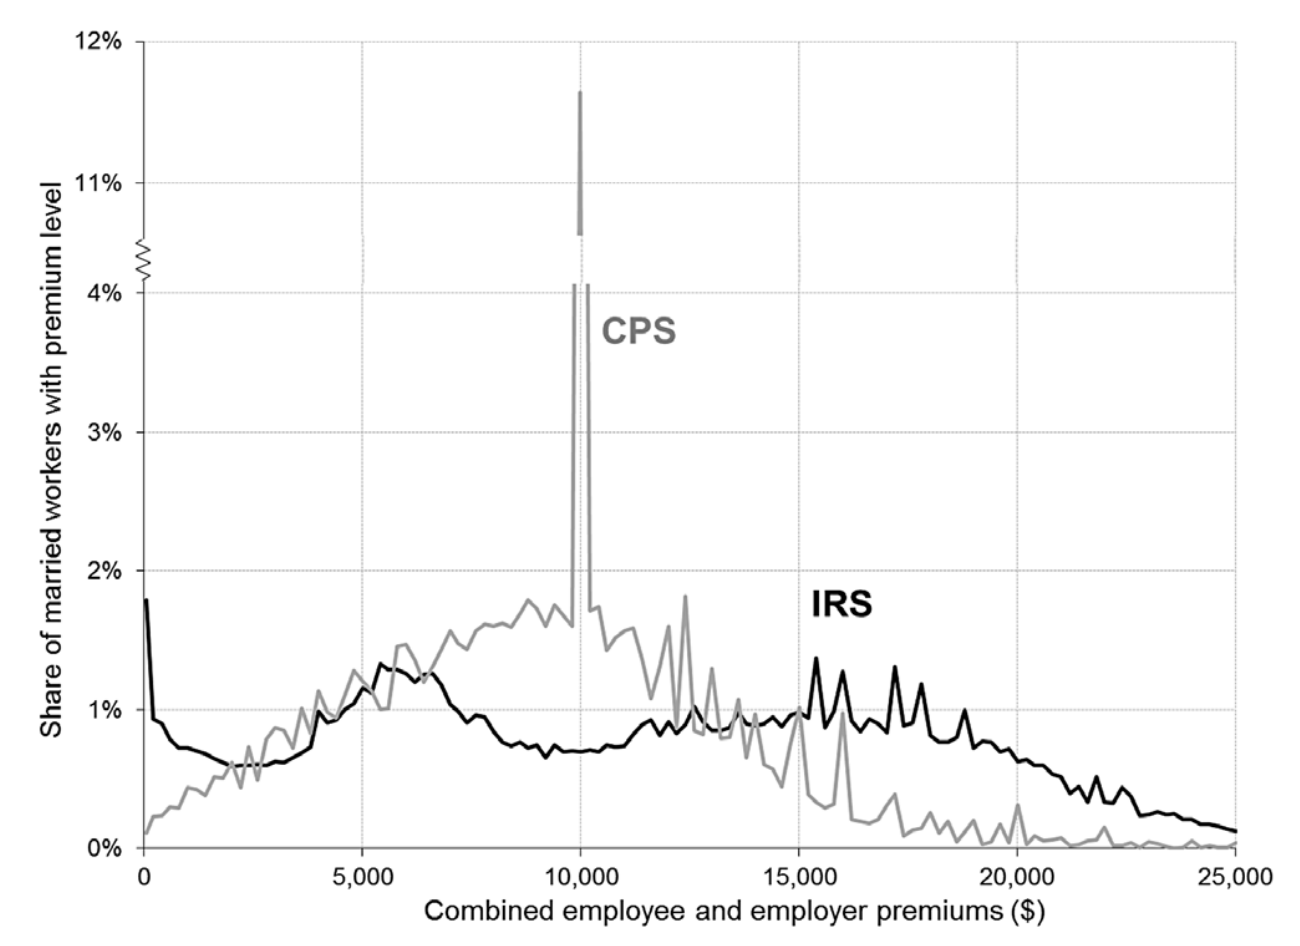
Distribution of health insurance premiums among married workers. Shares are per $200 range.
Abstract
For much of the 20th century, America's central cities were viewed as synonymous with economic and social hardship, and often used as proxy for low-income communities of color. Since the 1990s, however, many metropolitan areas have seen a resurgence of interest in central city neighborhoods. Theoretical models of income sorting lead to ambiguous predictions about where households of different income levels will live within metropolitan areas. Results indicate that, on average, income and white population shares increase with distance to city centers. However, many centrally located neighborhoods are neither low-income nor majority non-white, while low-income and minority neighborhoods are spatially dispersed across most metropolitan areas.
Abstract
Using a panel of household level tax data, we estimate the degree to which dependents are reassigned between tax units within the same household, and how these reassignments affect combined tax liabilities. Reassigning dependents reduces combined tax liabilities on average, suggesting some household level coordination. Additionally, when earned income tax credit (EITC) benefits expanded in 2009, reassignments increasingly involved adding a third child to tax returns to claim these new benefits. However, the subgroup reassigning towards three child tax units actually increased total household tax liabilities, suggesting that some tax units may prioritize minimizing their own tax burden or focus on particularly salient aspects of tax policy.
Abstract
Since 2012, the Congressional Budget Office has included an estimate of the market value of government-provided health insurance coverage in its measures of household income. We follow this practice for both public and private health insurance to capture the impact of greater access to government-provided health insurance for working-age people with disabilities, whose market value rose in 2010 dollars from $11.7 billion in 1980 to $114.3 billion in 2012. We then consider the more general implications of incorporating estimates of the market price of insurance, equivalent to that provided by the government, into policy analyses in a post-Affordable Care Act world.
Abstract
Inconsistent censoring in the public-use March Current Population Survey (CPS) limits its usefulness in measuring labor earnings trends, as previous approaches for imputing topcoded earnings systematically understate top earnings. Using Pareto estimation methods with less-censored internal data, we create an enhanced cell-mean series to capture top earnings in the public-use data. Annual earnings inequality trends since 1963 using our series largely mirror those found by Kopczuk, Saez, and Song using social security administration data for commerce and industry workers. When we extend our analysis to 2013 and consider all workers, earnings inequality levels are higher but its growth is more modest.
Key Figures
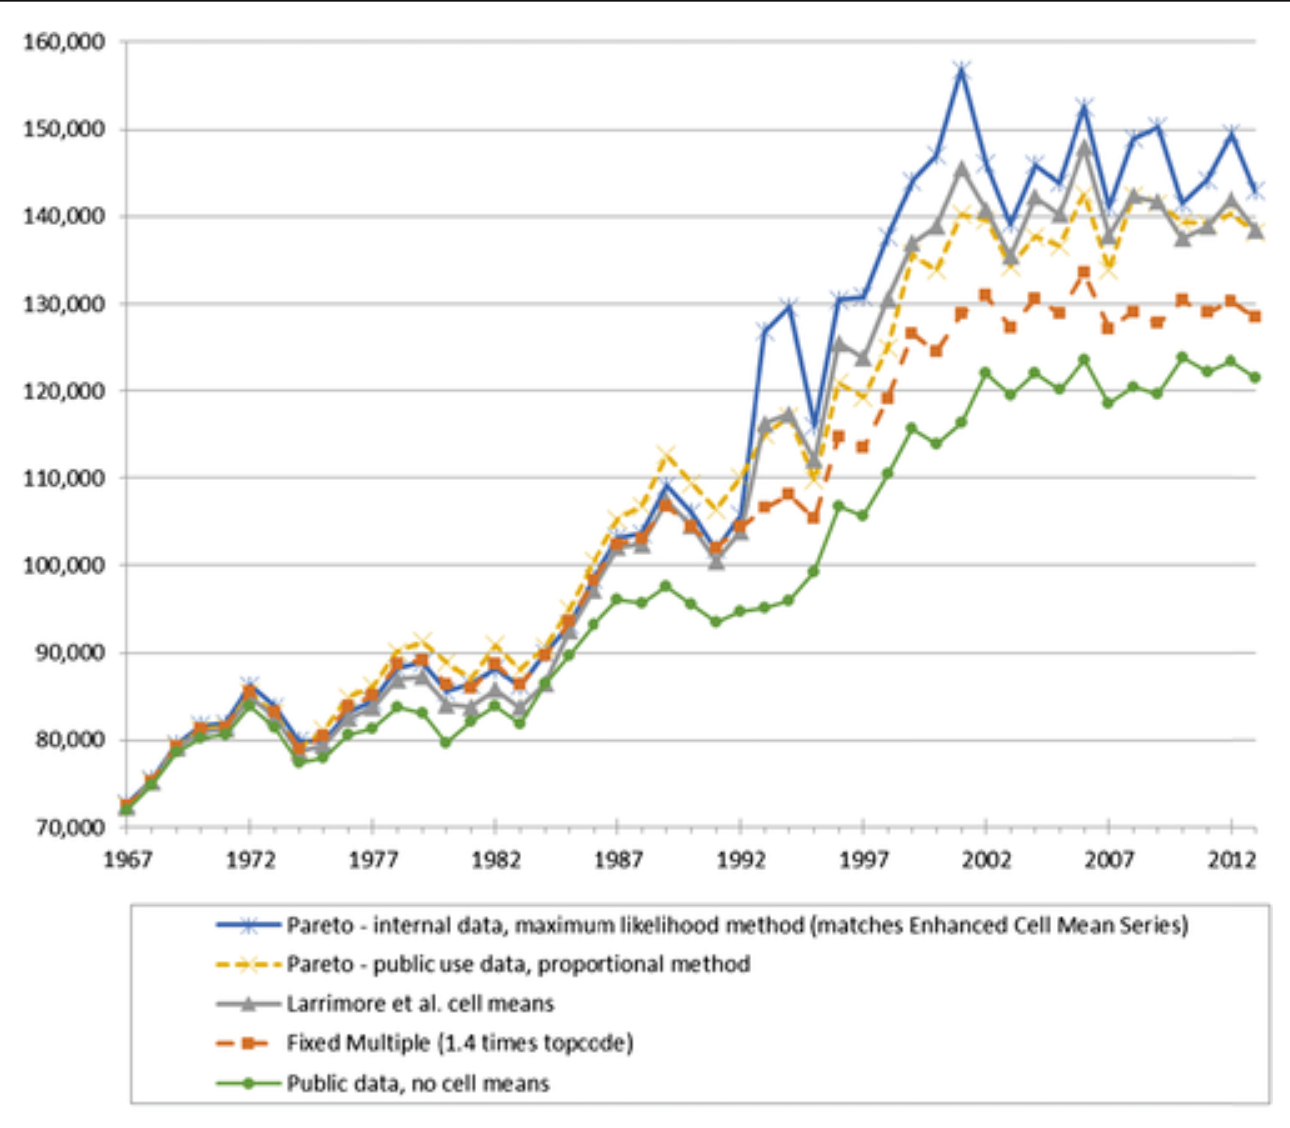
Mean Earnings of the Top 5% of Earners by Topcode Correction Method (in 2010 Dollars)
Abstract
With data from the March CPS and using shift-share analysis, we analyze the factors that account for changes in post-tax post-transfer income during each of the past four recessions. What distinguishes the Great Recession is that drops in employment rather than wage earnings drove income declines. In addition, taxes and transfers played a much greater role in offsetting market income losses --a result largely missed in analyses that do not account for taxes and transfers. This is particularly so among the bottom quintile of the distribution where lower and increased transfers offset more than one-half of the market income declines.
Abstract
Using a shift-share analysis on March CPS data, this paper estimates the degree to which changes in labor earnings, employment, and marriage patterns account for household income inequality growth in the United States since 1979. The factors contributing to the rapid rise in income inequality in the 1980s differ substantially from those contributing to its slower increase since that time. Unlike findings for the 1980s when changes in the correlation of spouses' earnings accounted for income inequality growth, this factor is no longer a major contributor toward its continued increase. Additionally, the 2000s business cycle is the first full business cycle in at least 30 years where changes in earnings of male household heads accounted for declines in income inequality. Instead, the continued growth in income inequality in the 2000s was accounted for primarily by increases in female earnings inequality and declines in both male and female employment.
Abstract
Recent research on U.S. levels and trends in income inequality varies substantially based on how these studies measure income. We crosswalk (move between standards) from a market income of tax units to a more comprehensive measure of income including realized capital gains of households using a unified data set and replicate common findings in the literature. By using a comprehensive income definition in the spirit of Haig-Simons, considering yearly accrued capital gains rather than focusing on the delayed reporting of capital gains that appear in Internal Revenue Service tax return data, the observed growth in income inequality and top income shares since 1989 is dramatically reduced.
Abstract
Recent research on levels and trends in the United States in income inequality vary substantially in how they measure income. We show the sensitivity of alternative income measures in capturing income trends using a unified data set. Focusing solely on market income or including realized taxable capital gains based on IRS tax return data in more comprehensive household income measures will dramatically increase inequality growth compared to capital gains measures more in keeping with Haig-Simons principles. Using a measure of yearly accrued capital gains dramatically reduces observed growth in income inequality across the distribution, but also equalizes income growth since 1989.
Abstract
Researchers considering levels and trends in the resources available to the middle class traditionally measure the pre-tax cash income of tax units or the pre-tax, post-transfer, size-adjusted income of households. Choices regarding the income measure and sharing unit to be analyzed, as well as other methodological choices, carry significant implications for assessing income trends. In particular, we show that focusing on tax units rather than households and not adjusting for sharing unit size greatly reduces measured growth in middle class income, as does excluding the effect of taxes and the value of in-kind benefits. As an example, we demonstrate how much these distinctions change the observed distribution of benefits from the tax exclusion of employer provided health insurance.
Abstract
Although most U.S. income inequality research is based on public use March CPS data, a new wave of research using IRS tax return data reports substantially faster inequality growth for recent years. We show that these apparently inconsistent estimates are largely reconciled when the income distribution and inequality are defined the same way. Using internal CPS data for 1967 to 2006, we show that CPS-based estimates of top income shares are similar to IRS data-based estimates reported by Piketty and Saez (2003). Our results imply that income inequality changes since 1993 are largely driven by changes in incomes of the top 1%.
Abstract
The existence of a positive relationship between income and morbidity has been well documented in the literature. But it is unclear whether the relationship is positive because increased income allows individuals to purchase more health inputs that improve their health, because healthy individuals are more productive and thus can earn higher wages in the labor market, or because a third factor is improving health and increasing income. This article explores whether increases in income improve the health of the low-income population. I found only limited support for the theory that the relationship between income and morbidity is derived from shifts in income. Although I did observe a correlation between income and self-reported health, I found no evidence that increases in income significantly improve self-reported health statuses. In addition, while increases in income appear to reduce the prevalence of hearing limitations when using corrective measures, these increases did not have a significant effect on most of the other functional limitations considered here.
Abstract
We analyze trends in US size-adjusted household income inequality between 1975 and 2004 using the most commonly used data source—the public use version of the March Current Population Survey. But, unlike most researchers, we also give substantial attention to the problems caused by the topcoding of each income source in the CPS data. Exploiting our access to Census Bureau internal CPS data, we examine estimates from data incorporating imputations for topcoded incomes derived from cell means and estimates from data multiply-imputed from parametric distribution models. Our analysis yields robust conclusions about inequality trends. The upward trend in US income inequality that began in the mid-1970s and increased in the 1980s slowed markedly after 1993.
Press
Abstract
To measure income inequality with right-censored (top-coded) data, we propose multiple-imputation methods for estimation and inference. Censored observations are multiply imputed using draws from a flexible parametric model fitted to the censored distribution, yielding a partially synthetic data set from which point and variance estimates can be derived using complete-data methods and appropriate combination formulae. The methods are illustrated using US Current Population Survey data and the generalized beta of the second kind distribution as the imputation model. With Current Population Survey internal data, we find few statistically significant differences in income inequality for pairs of years between 1995 and 2004. We also show that using Current Population Survey public use data with cell mean imputations may lead to incorrect inferences. Multiply-imputed public use data provide an intermediate solution.
Key Figures
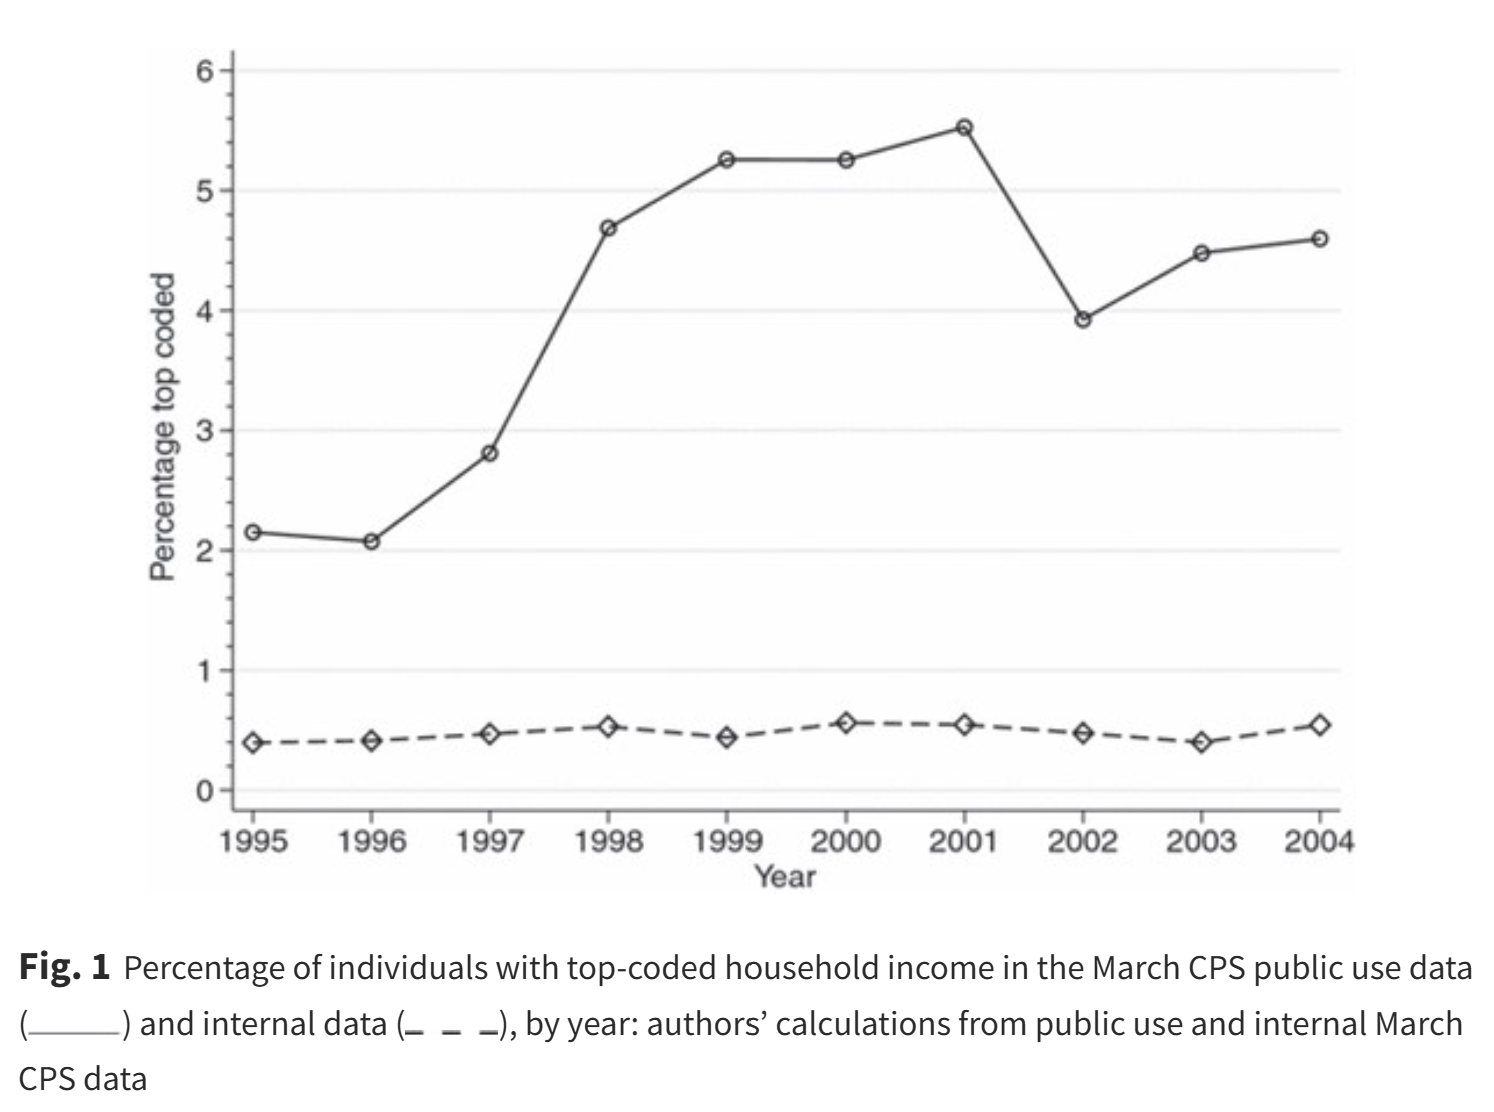
Percentage of individuals with top-coded household income in the March CPS public use data
Abstract
This study examined the relationship between language use and persuasion success in the Peer-to-Peer (P2P) lending environment where unaffiliated individuals borrow money directly from each other using a textual description to justify the loan. Over 200,000 loan requests were analyzed with Linguistic Inquiry and Word Count (LIWC) software. The use of extended narratives, concrete descriptions and quantitative words that are likely related to one's financial situation had positive associations with funding success which was considered to be an indicator of trust. Humanizing personal details or justifications for one's current financial situation were negatively associated with funding success. These results offer insights into how individuals can optimize their persuasiveness by monitoring their language use in online environments.
Abstract
Using internal March CPS data, we construct and make available variances and cell-means for all topcoded income values in the public-use CPS. We then demonstrate how their inclusion can improve existing imputation methods in the labor earnings inequality literature.
Abstract
Policy makers relying on public-use Current Population Survey (CPS) data to measure the success of government policies in overcoming the gap in economic well-being between working-age men with and without disabilities will understate the mean income of both and overstate the relative economic well-being of the former. This understatement results from topcoding in the public-use CPS, which suppresses top incomes in the data set. Using cell means with the public-use CPS, the authors better correct for these topcoding problems than alternate methods and provide a relative economic well-being series (1980—2006) based on the mean incomes of working-age men with and without disabilities.
Key Figures
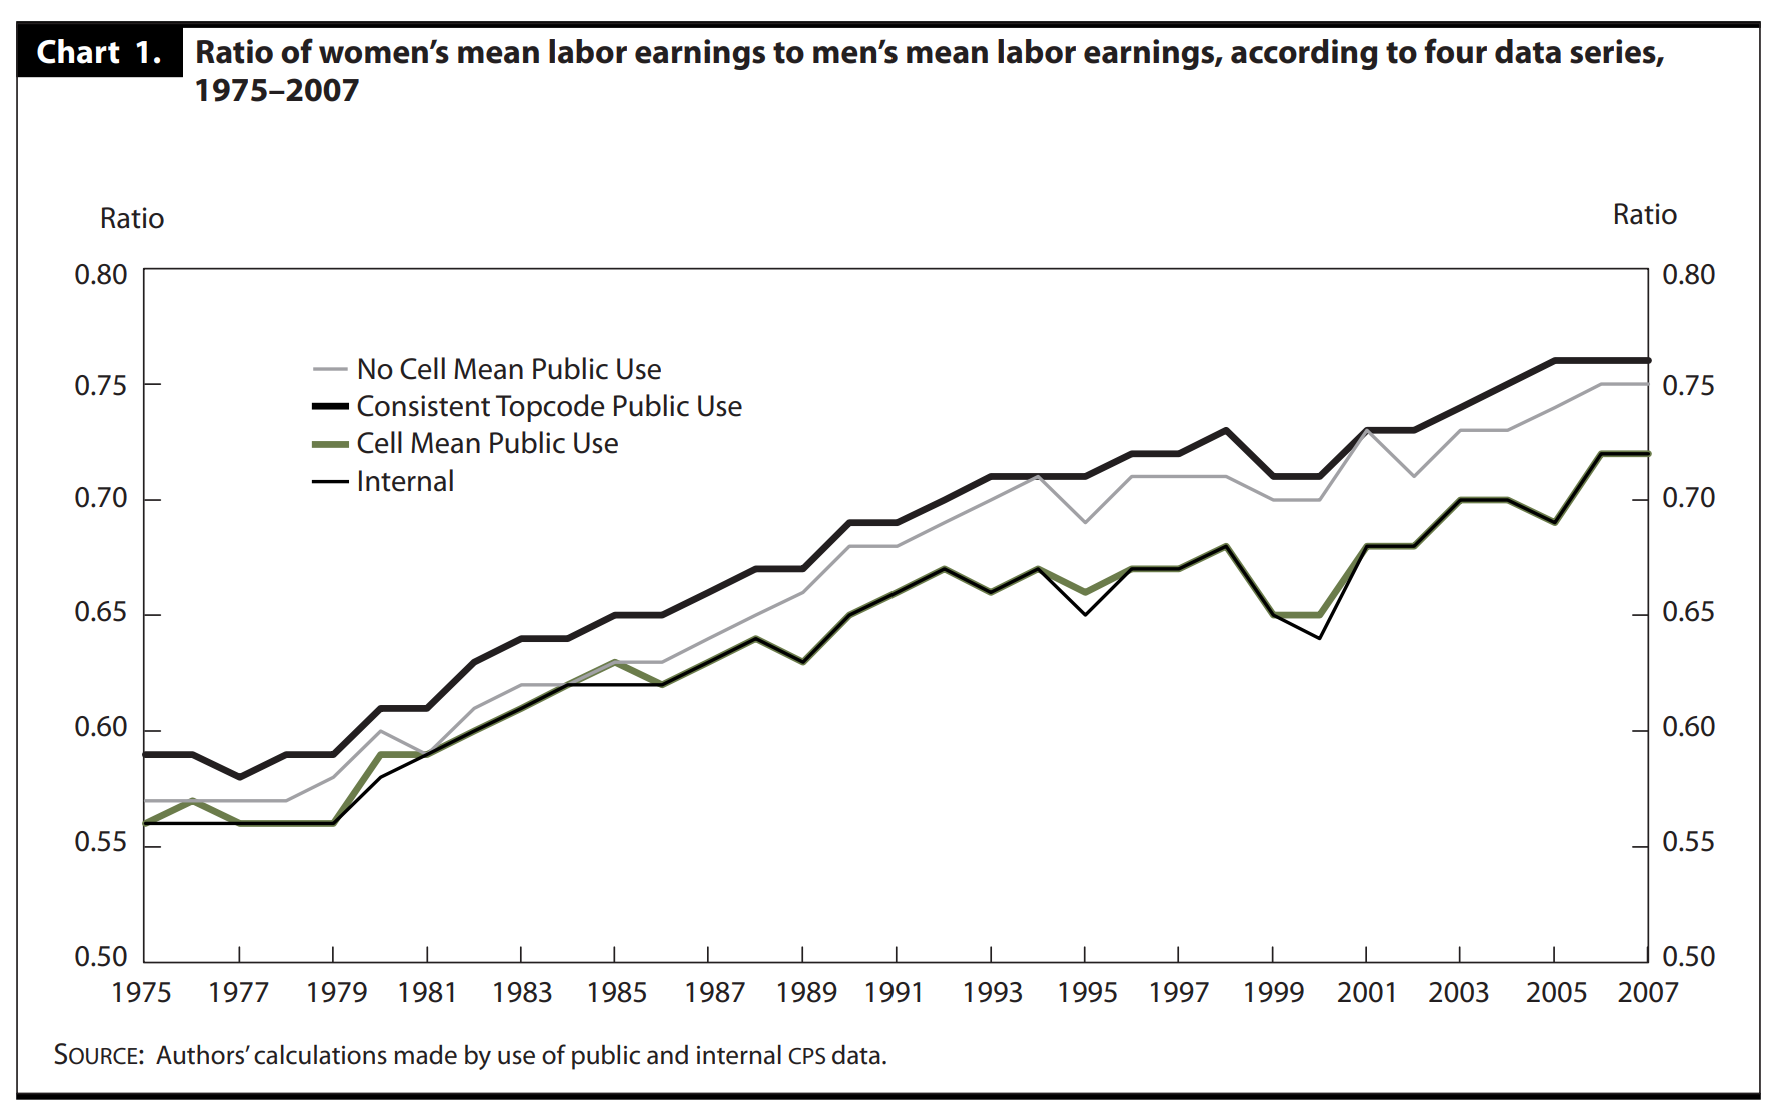
Male-Female earnings gap by topcoding approach
Abstract
Using the internal March CPS, we create and in this paper distribute to the larger research community a cell mean series that provides the mean of all income values above the topcode for any income source of any individual in the public use March CPS that has been topcoded since 1976. We also describe our construction of this series. When we use this series together with the public use March CPS, we closely match the yearly mean income levels and income inequalities of the US population found using the internal March CPS data.
Book Chapters
Presence and Persistence of Poverty in U.S. Tax Data
Middle-Class Redistribution: Tax and Transfer Policy for Most Americans
Press
Income and Earnings Mobility in U.S. Tax Data
Median Income and Income Inequality: From 2000 and Beyond
Research Briefs & Policy Notes
Poverty in 2021 Correcting for Unemployment Insurance Underreporting
Improving Housing Payment Projections during the COVID-19 Pandemic
Household Finances Under COVID-19: Evidence from the Survey of Household Economics and Decisionmaking
Shedding Light on Our Economic and Financial Lives
Assessing the Severity of Rent Burden on Low-Income Families
Holiday Spending and Financing Decisions in the 2015 Survey of Household Economics and Decisionmaking
What are the Perceived Barriers to Homeownership for Young Adults?
Financial Well-Being of Individuals Living in Areas with Concentrated Poverty
Should You Trust Things You Hear Online? Comparing SHED and Census Bureau Survey Results
Does it Matter who Your Parents are? Findings on Economic Mobility from the Survey of Household Economics and Decisionmaking
Contributions to Government Reports
"Economic Well-Being of U.S. Households in 2024." Federal Reserve Board, 2025. Also contributed to nine earlier versions (2014–2018, 2020–2024) and a COVID-19 supplemental report.
"Economic Report of the President Together with The Annual Report of the Council of Economic Advisers." Council of Economic Advisers, 2019.
"Modeling the Distribution of Taxes of Business Income." Joint Committee on Taxation, 2013.
Awards & Honors
2020. Federal Reserve Board Special Achievement Award
2013. Addington Prize in Measurement, Fraser Institute
2012. Richard Musgrave Prize for the best article published in the National Tax Journal
2009. U.S. Census Bureau Dissertation Mentorship Program
2006. Louis Walinsky Fund in Economics Teaching Award, Cornell University